Figure 7.
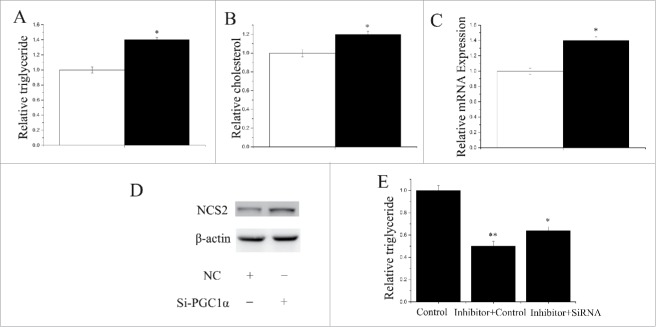
Functional evaluation of PPARGC1A (A) TAG levels in cells transfect with Si-NC (60nM) or SiRNA-PPARGC1A (60nM); TAG levels are compared with that of control (n = 6). White bars: negative control; black bars: SiRNA-PPARGC1A. (B) Cholesterol levels in cells transfect with Si-NC (60nM) or SiRNA-PPARGC1A (60nM); cholesterol levels are compared with that of control (n = 6). White bars: negative control; black bars: SiRNA-PPARGC1A. (C) GMECs are transfected with Si-NC (60nM) or SiRNA-PPARGC1A (60nM) for 48h, and the mRNA expression of β-Casein is quantified by RT-qPCR (n = 6). White bars: negative control; black bars: SiRNA-PPARGC1A. (D) Western blot analysis of β-Casein expression in the Si-NC (60nM) or SiRNA-PPARGC1A (60nM) treatment experiments The effect of Si-NC (60nM) or SiRNA-PPARGC1A(60nM) for 48h on β-Casein protein expression is evaluated by Western blot analysis in GMECs. Total proteins are harvested for 48h post-treatment, respectively. (E) TAG levels in cells transfect with Control inhibitor (50nM) + Control siRNA (50nM), Inhibitor-miR-148a (50nM) + Control siRNA (50nM) and Inhibitor-miR-148a (50nM) + siRNA-PPARGC1A(50nM); TAG levels are compared with that of control (n = 6).

