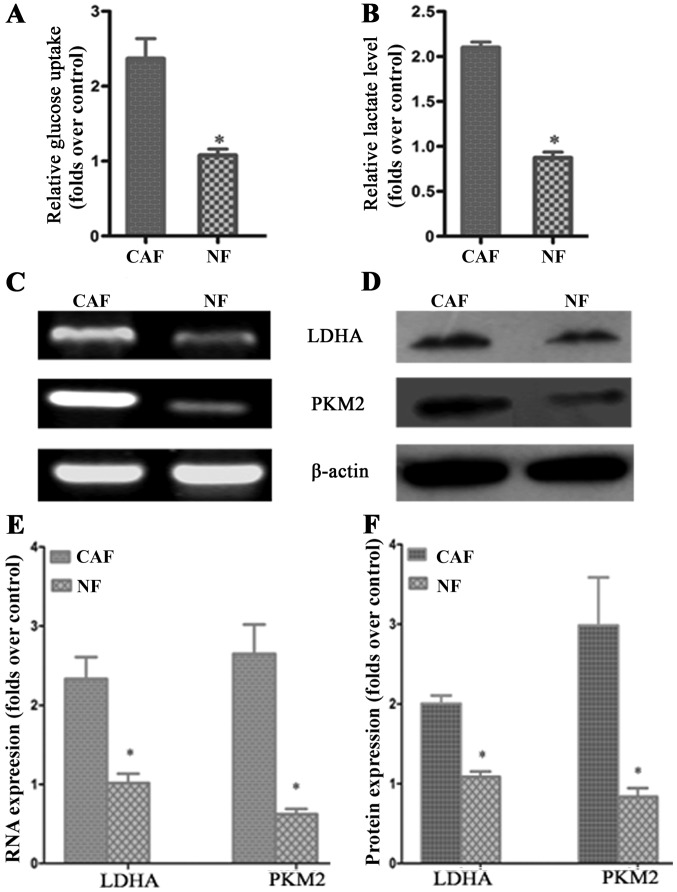
Figure 2.
CAF glycolytic metabolism. (A and B) Glucose uptake and lactate production in cancer-associated fibroblasts (CAFs) were significantly increased compared to that in normal fibroblasts (NFs). (C and D) PCR and western blot results showed that LDHA and PKM2 mRNA and protien were highly expressed in CAFs. (E and F) Results of statistical analysis. The results relative to control cells are presented as a standard ratio; *P<0.05 by t-test.

