Figure 1.
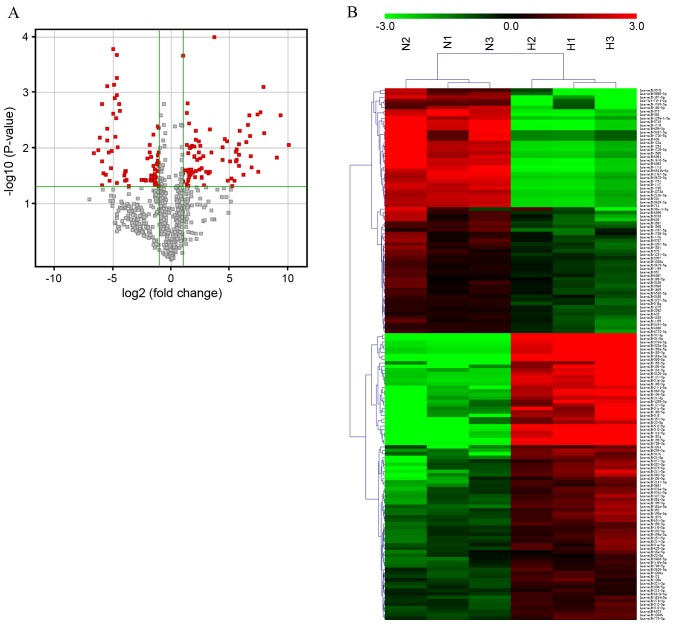
miRNA expression signature profiling in HS. (A) Volcano plot presenting differentially expressed miRNAs between HS and paired NS tissue. miRNA microarray expression profiling from three paired HS and NS tissues was performed. Differentially expressed miRNAs were identified by fold change and a P-value calculated using Student's t-test. The threshold set to identify up and downregulated genes was a fold change ≥2 and P<0.05. Red dots indicate points-of-interest that exhibit large-magnitude fold-changes (x-axis; log2 of the fold change) and high statistical significance (y-axis; -log10 of the P-value). (B) Hierarchical clustering showing differentially expressed miRNAs from HS samples compared with paired NS tissues. Each row represents one miRNA and each column represents one tissue sample. The relative miRNA expression is depicted according to the color scale. Red indicates upregulation and green indicates downregulation. N1-3 represents NS tissue samples, whereas H1-3 represents HS tissue samples. The differentially expressed miRNAs were clearly separated into clusters. miRNA, microRNA; hsa-miR, human microRNA; HS, hypertrophic scar; NS, normal skin.

