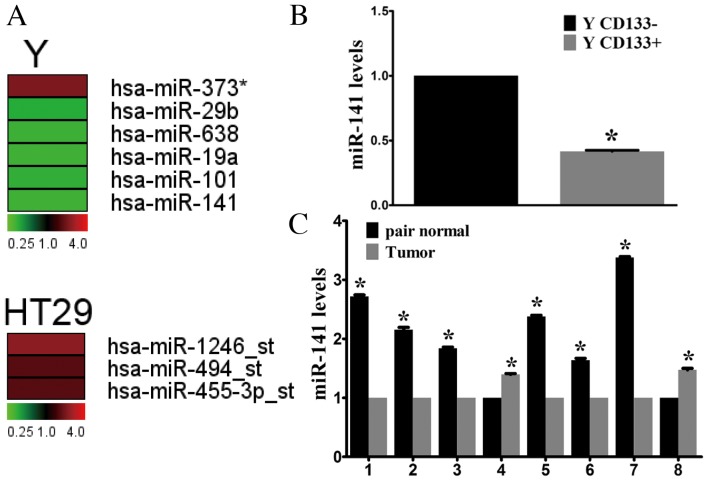
Figure 1.
miR-141 expression levels in CSCs and CRC tumor tissue. (A) Differentially expressed miRNAs in CD133+ (a marker of CSCs) and CD133− cells. Red denotes high and green denotes low levels of expression in CD133+ cells compared with CD133− cells. (B) miR-141 expression levels in CD133+ and CD133− Y cells were verified using RT-qPCR. *P<0.05 vs. CD133−. (C) miR-141 expression levels in fresh CRC tissues and adjacent healthy tissues from eight patients, as assessed by RT-qPCR. The y-axis indicates the fold change. *P<0.05 vs. paired sample. miR, microRNA; CSCs, cancer stem cells; CRC, colorectal cancer; CD, cluster of differentiation; RT-qPCR, reverse transcription-quantitative polymerase chain reaction.

