Figure 3.
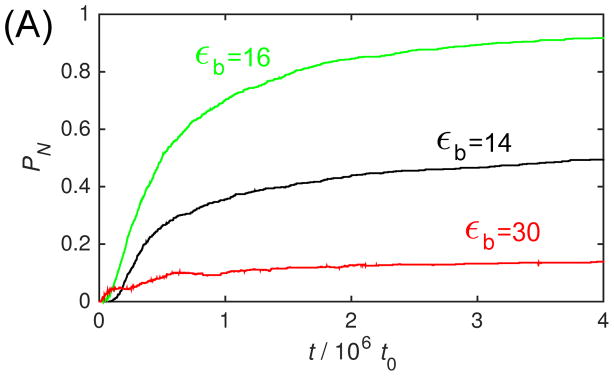
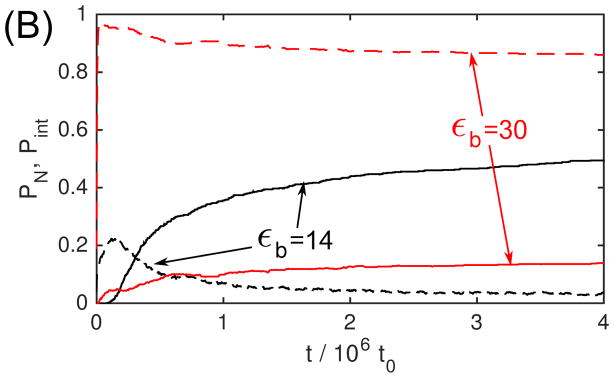
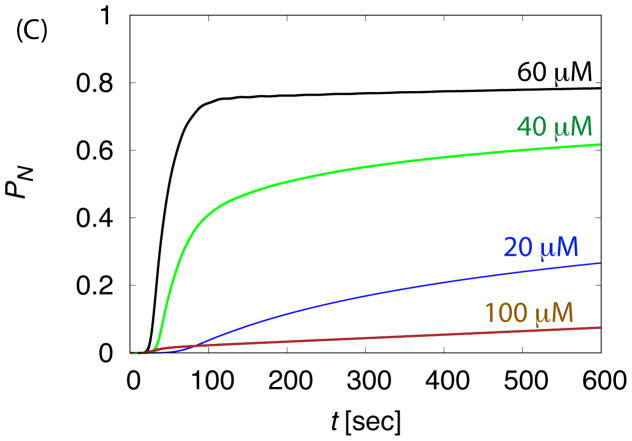
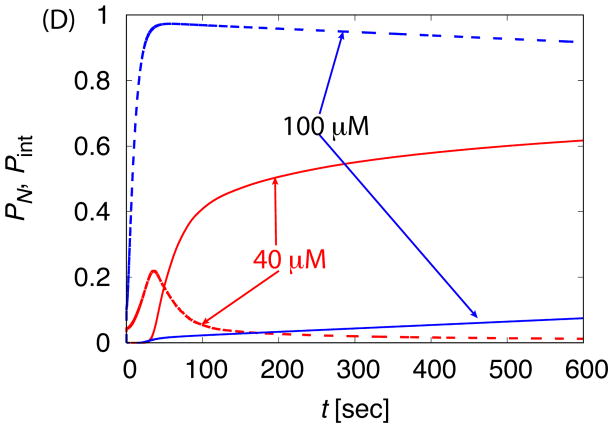
The dependence of assembly kinetics on parameter values for ‘No Allostery’. (A) The fraction of subunits in complete capsids PN observed in Brownian dynamic simulations (BD) is shown as a function of time for indicated values of the binding energy parameter εb. (B) The fraction capsid (solid lines) is compared to the fraction of subunits in intermediates Pint (dashed lines) for small and large values of εb. For (A) and (B), each simulation is run until 1.5 × 10⁷t0, and each data point corresponds to an average over 20 independent simulations. (C) The fraction capsid as a function of time measured for the master equation is shown at indicated total subunit concentrations c0, with binding affinity gb = −7 (all energies are in units of kBT). (D) The fraction capsid is compared to the intermediate fraction for the master equation, for concentrations below and above the trapping point ckt = 60μM (Eq. 5).


