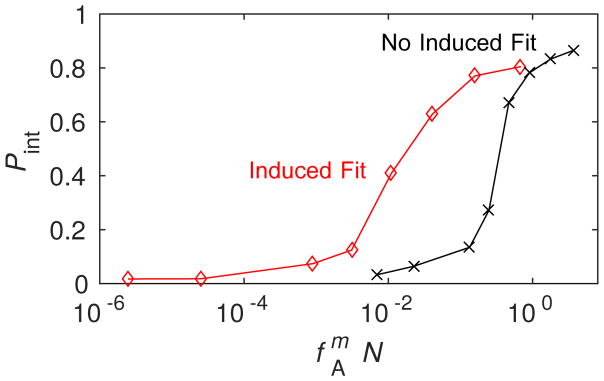
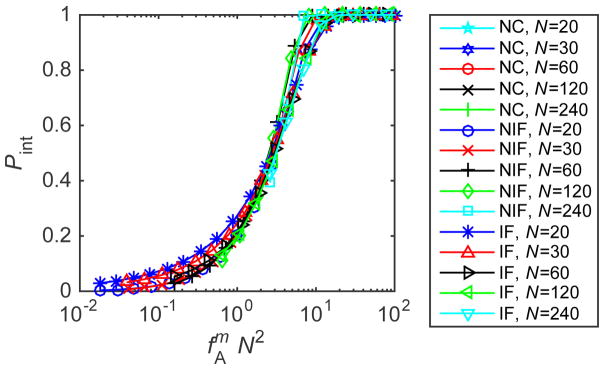
Figure 6.
(top) Kinetic trapping in BD simulations. The magnitude of trapping Pint measured in BD simulations is shown in the limit of very high subunit binding strength (εb = 40). Results are shown as a function of the high affinity trapping parameter , with m = 1 or 2 respectively for the ‘No Induced Fit’ and ‘Induced Fit’ cases (see Eq. (10)) and N = 20. The parameter fA was tuned by varying gA/kBT from 1 to 6. Other parameters are as in Fig. 3. (bottom) Relationship between capsid size and sensitivity to trapping in the high-affinity limit from the master equation. The magnitude of trapping Pint calculated for gb = −25 is shown for the three conformation cases and capsid sizes N ∈ [20, 240]. The parameter fA was tuned by varying gA/kBT from 0 to 10.


