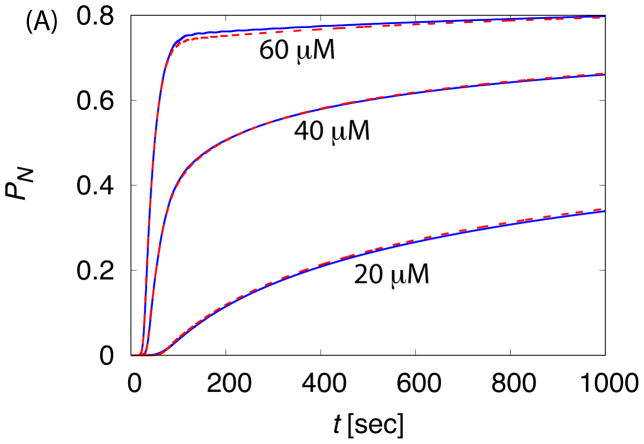
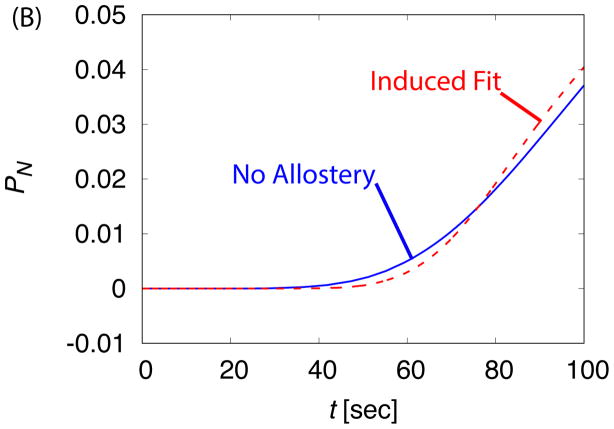
Figure 9.
The time-dependence of assembly is compared between the ‘No Allostery’ (solid lines) and ‘Induced Fit’ (dashed lines) cases for c0 = 20μM. (A) The fraction capsid is shown for indicated initial subunit concentrations. (B) The early time course of assembly is shown for both cases at c0 = 20μM, showing that ‘Induced Fit’ exhibits a sharper take off at the end of the lag phase in comparison to ‘No Allostery’.


