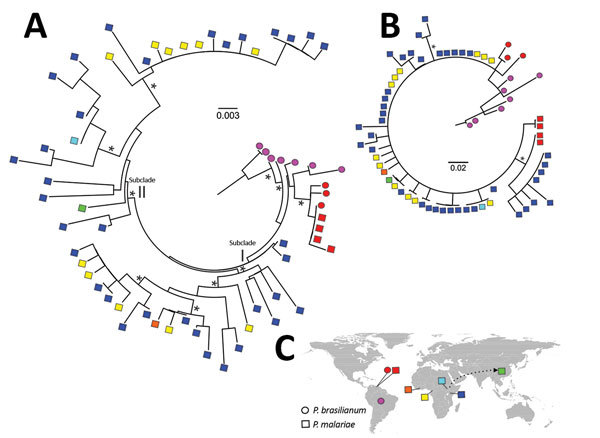
Figure 4.

Maximum-likelihood analyses of circumsporozoite protein gene (csp) sequences of Plasmodium malariae and distribution of the samples. A) Phylogenetic tree based on maximum-likelihood analyses of the entire csp amino acid sequences of P. malariae isolates from different geographic regions, shown by different colors. Asterisks denote clade with >90% bootstrap support. Sequences of P. malariae from Venezuela (red squares) were almost identical to those of P. brasilianum (red circles) from the same area. These samples were genetically closely related with P. brasilianum from Brazil (violet circles) but distant from P. malariae from East and West Africa. The samples from Africa were subdivided into 2 subclades, I and II. Subclade I comprised a mix of P. malariae isolates from Kenya (dark blue squares), Cameroon (yellow squares), and Côte d’ Ivoire (orange squares). Subclade II comprised a mix of P. malariae isolates from Kenya, Cameroon, Uganda (light blue squares), and China (green squares). B) Maximum-likelihood analyses of partial csp amino acid sequences without the central repeat region. P. brasilianum from Brazil was distant from P. malariae, but relationships among the P. malariae samples from different geographic areas were not well resolved. C) Locations of samples included in the analyses. Arrow indicates the possible African origin of P. malariae from China. Scale bars indicate length of phylogenetic tree. *Bootstrap value >90%.
