Figure.

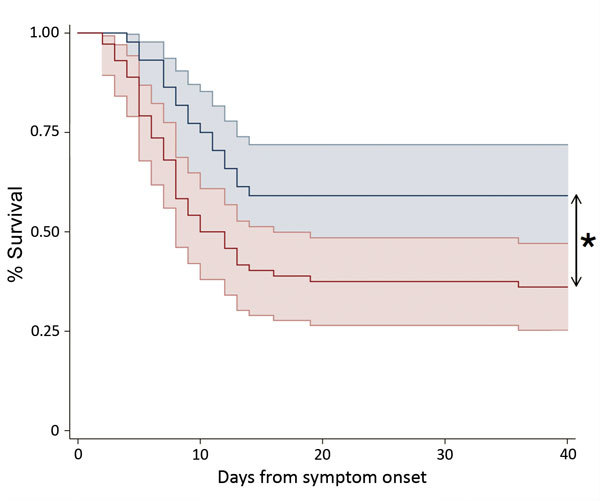
Kaplan-Meier survival plot stratified by referral pathway for patients admitted directly to an Ebola treatment center (ETC) with confirmed Ebola virus disease (cohort 1, blue line) and for patients diagnosed at the ETC (cohort 2, red line). Plots show the percentage of patients surviving as a function of time (days) from reported symptom onset. Shaded areas indicate 95% CIs. *p<0.05.
