
Figure.
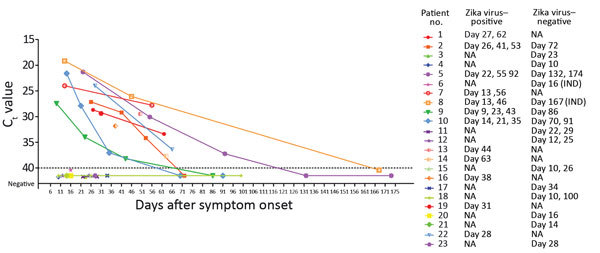
Cycle threshold (Ct) values of semen samples analyzed to determine presence and persistence of Zika virus RNA in semen, United Kingdom, 2016. All references to days indicate days after onset of symptoms. The dotted line represents the limit of detection for the assay. The lines represent implied decay rates based on longitudinal data; however, they should not be used to infer exact data between analyzed samples. In particular, the point at which viral RNA became undetected cannot be accurately inferred from the curves for patients 5, 8, 9, and 10. Patient 6 had a previous vasectomy, and patient 8 was receiving immunosuppressive drug therapy at the time of sampling. IND, indeterminate; NA, not available.