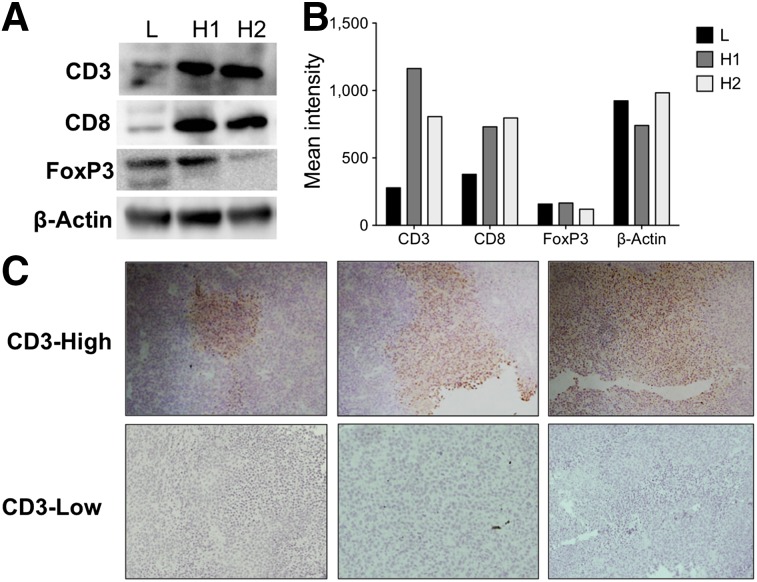
FIGURE 2.
Ex vivo quantification and localization of T-cell infiltrate protein. (A) Western blot analysis of treated CT26 tumors shows 1 tumor with low CD3 expression (L) and 2 tumors with high CD3 expression (H1 and H2) and their CD8, FoxP3, and β-actin characteristics. (B) Quantification reveals relatively high concentrations of CD3 and CD8 in H1 and H2 tumors, uniformly low immunosuppressive FoxP3 protein, and similar overall total β-actin protein across all samples. (C) Representative areas of high and low CD3 infiltration show spatial localization on immunohistochemical staining.

