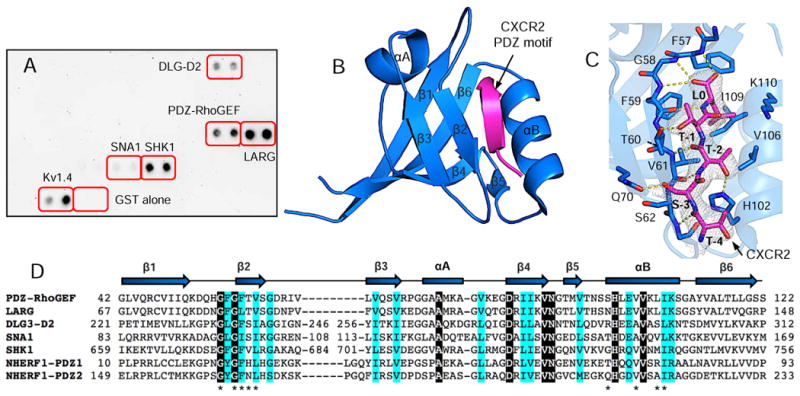
Figure 1.

Structure of PDZ-RhoGEF PDZ (rPDZ) in complex with the CXCR2 C-terminal sequence TSTTL. (A) PDZ Array screen of CXCR2-binding PDZ domains. Kv1.4 serves as a positive control for PDZ–peptide binding, and GST alone a negative control. (B) Ribbon diagram of rPDZ–CXCR2 structure. The PDZ is shown in blue and CXCR2 in magenta. Secondary structures are numbered and labeled based on their sequence position. (C) Detailed view of the PDZ ligand-binding site. 2Fo – Fc omit map of CXCR2 peptide was calculated at 2.4 Å and contoured at 1.0 σ. Hydrogen bonds are illustrated as yellow broken lines. (D) Sequence alignment of CXCR2-binding PDZ domains. Identical residues are represented as white on black and similar residues are colored in cyan. Residues important for binding to CXCR2 are indicated by asterisks. The secondary structure elements are labeled according to 1B.
