
Figure 2.
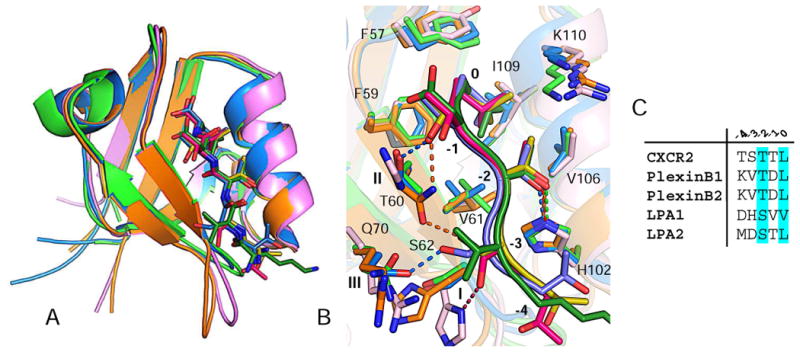
Structural comparison between PDZ–ligand complexes. (A) Superposition of rPDZ– CXCR2 (blue), rPDZ–PlexinB2 (green), NHERF1 PDZ1–CXCR2 (pink) and NHERF1 PDZ2– CXCR2 (orange). PDZ domains are represented by ribbon, and ligand residues are displayed as sticks. (B) Superposition of PDZ ligand-binding sites. Colors are identical from 2A. (C) Sequence alignment of last five residues of known rPDZ binding targets.