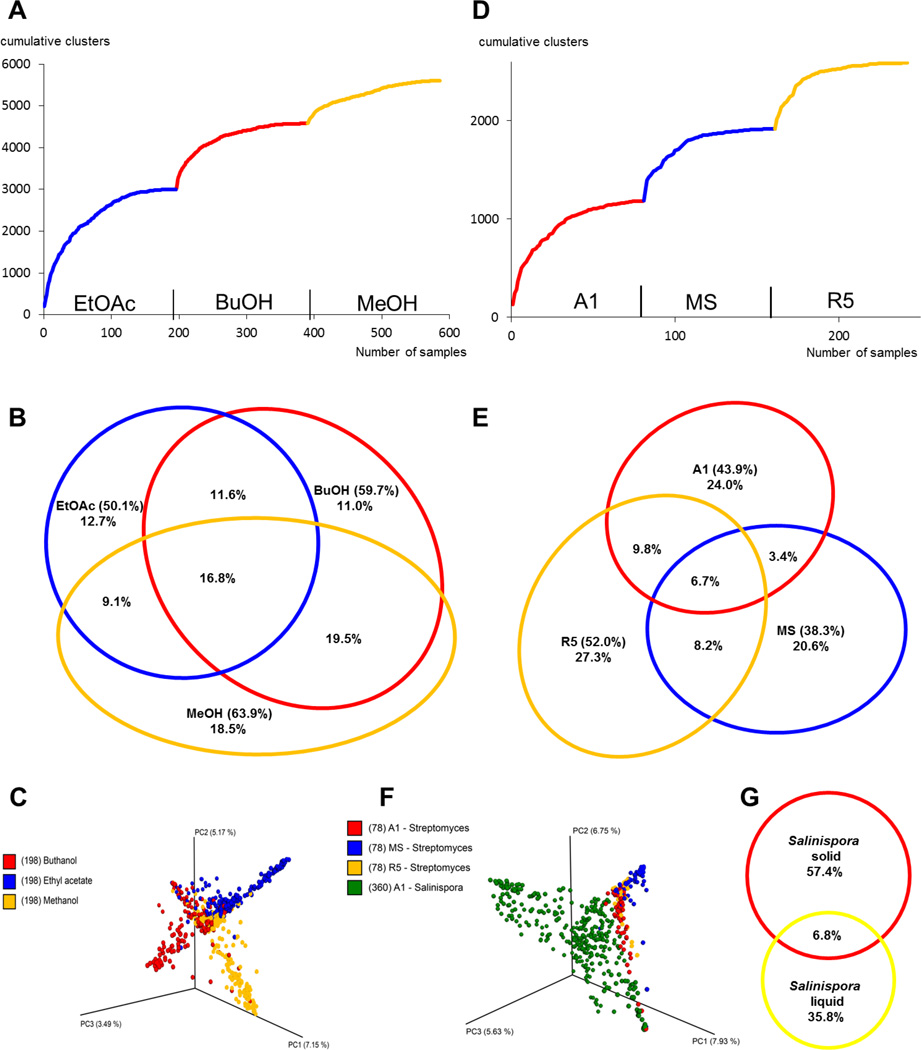
Figure 3. Effects of Additional Attributes on Molecular Diversity-Network Analysis.
Cumulative consensus curves for added unique spectra by each additional solvent (A) and Venn diagram for node distributions in the network for each solvent (B). C. Supervised random forest analysis of all samples classified by solvent. Cumulative consensus curves (D) and Venn diagram (E) for each medium (only from the Streptomyces extracts). Percentages are shown for each sector, with the total percentage for each treatment in parentheses. F. Supervised random forest analysis of all samples classified by growth medium. G. Comparison of liquid and solid extraction for 30 Salinispora strains (solvent: EtOAc).

