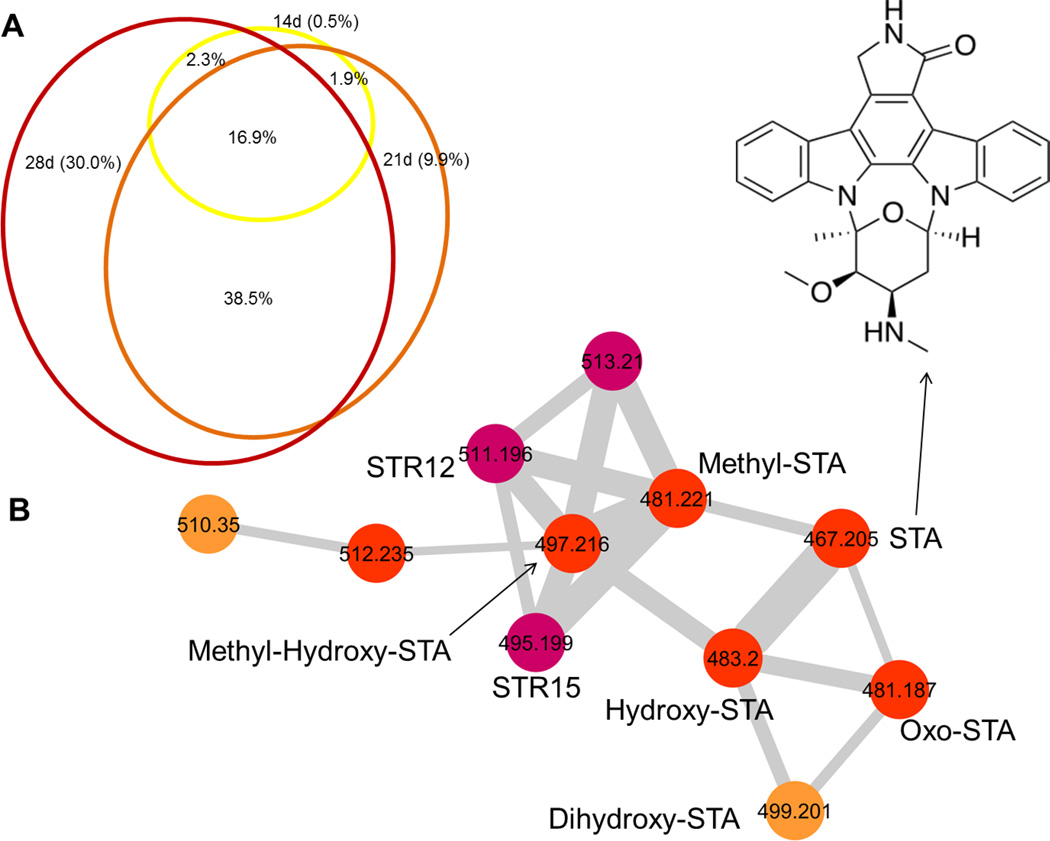
Figure 4. Time-dependent Changes in Natural Product Distribution in Salinispora arenicola CNH-877, Grown in ISP2.
A. Venn diagram representing node distributions in the molecular network at three time points (14, 21 and 28 days). B. The staurosporine (STA) molecular family in the network. Nodes represent masses (m/z) and edge thickness corresponds to cosine score between the nodes. Highlighted in red are masses that are present in samples taken at 14, 21 and 28 days. Orange nodes represent masses only present after 21 and 28 days, violet nodes are only present after 28 days.

