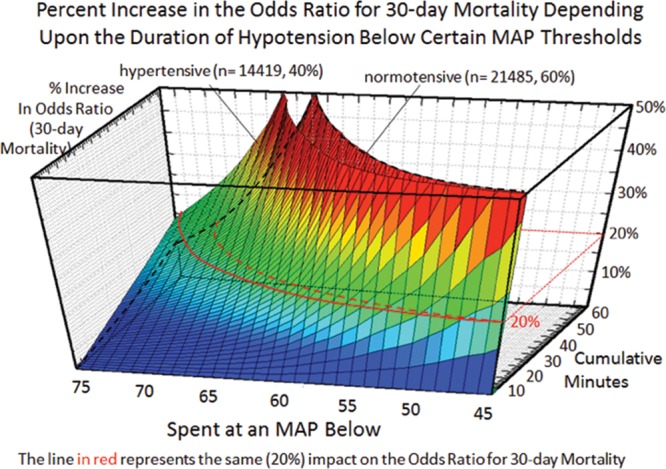
Figure 2.

Relationship between severity (x-axis) and duration (y-axis) of cumulative hypotensive exposures with 30-day mortality (z-axis).4 Although even extended exposures below a mean arterial blood pressure (MAP) of 75 had relatively little impact, even just a few minutes accumulated below an MAP of 50 portended a sharp increase in 30-day mortality. Note that for each hypotensive MAP threshold, less time was required to be accumulated in patients with a history of hypertension than in normal patients to incur the same relative increase in the odds ratio for 30-day mortality, the red lines indicating a 20% increase in normal patients (dotted line) versus patients with a history of hypertension (solid line).
