Fig. 3.

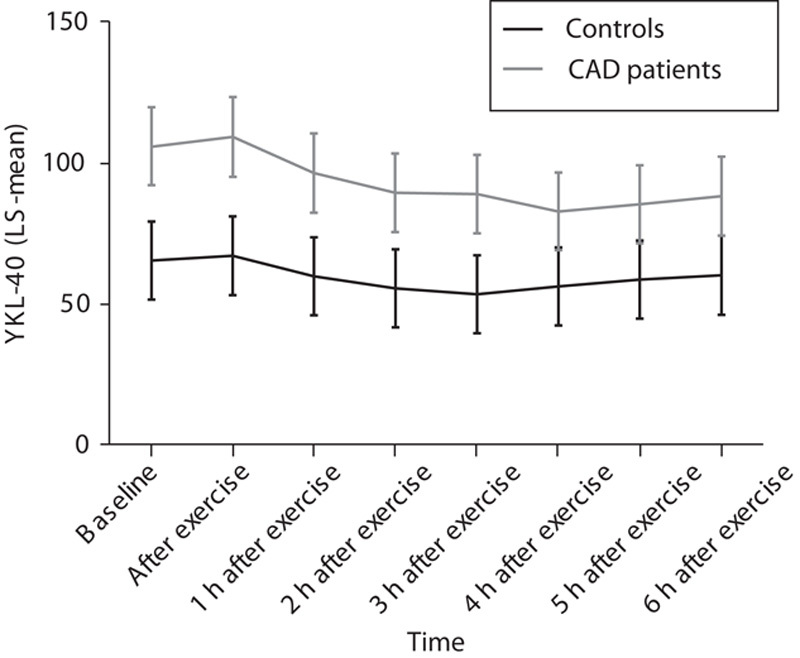
Mixed model for the interaction of time after exercise test and group (CAD patients vs. controls). y-axis: YKL-40 (LS-mean). x-axis: time after exercise test. CAD, coronary artery disease; LS, least square.

Mixed model for the interaction of time after exercise test and group (CAD patients vs. controls). y-axis: YKL-40 (LS-mean). x-axis: time after exercise test. CAD, coronary artery disease; LS, least square.