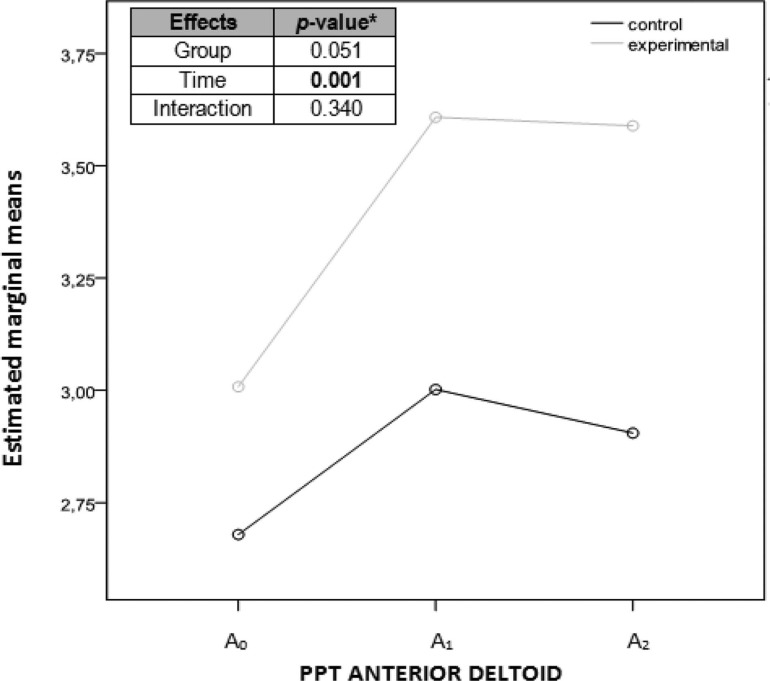
Figure 9.
Graph showing marginal means of the pressure pain threshold measurements of the anterior deltoid considering each group separately. Abscissa axis: horizontal with the 3 evaluation moments; ordinate axis: kg/cm2. aANOVA (analysis of variance) of repeated measurements with 2 factors, 2 (group) × 3 (time). A0, before the intervention; A1, immediately after the intervention; A2, a week after the intervention; PPT, pressure pain threshold.

