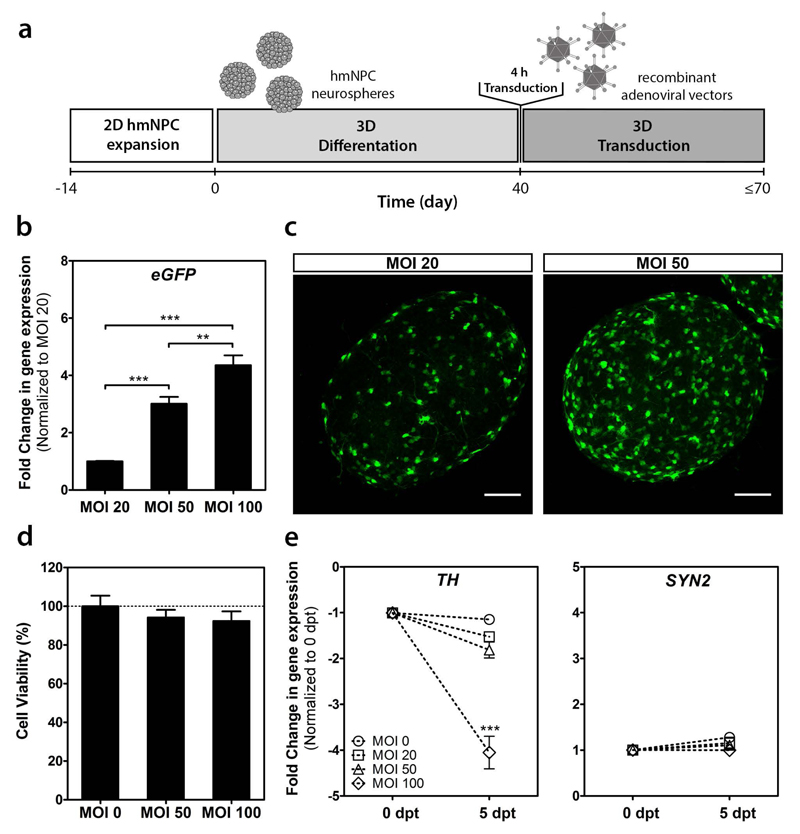
Figure 1.
hd-CAV-2 transduction of differentiated human midbrain-derived neural precursor cells (hmNPC) neurospheres. (a) Timeline of cell differentiation and transduction. (b) Fold changes of eGFP expression for multiplicities of infection (MOI) 20, 50 and 100 infectious particles per cell (normalized to MOI 20). (c) Confocal microscopy of whole neurospheres. Maximum intensity z-projections of 38 (MOI 20) and 33 (MOI 50) optical sections of 1 μm. Scale bars, 100 μm. (d) Cell viability assessment, normalized for control (MOI 0). (e) Fold changes in tyrosine hydroxylase (TH) and synapsin II (SYN2) gene expression at 0 and 5 days post-transduction (dpt) (normalized for 0 dpt). Each group was performed in triplicates. Data are mean ± s.e.m. of 3 independent experiments. Asterisks indicate significant difference (*P < 0.05, **P < 0.01, ***P < 0.001).

