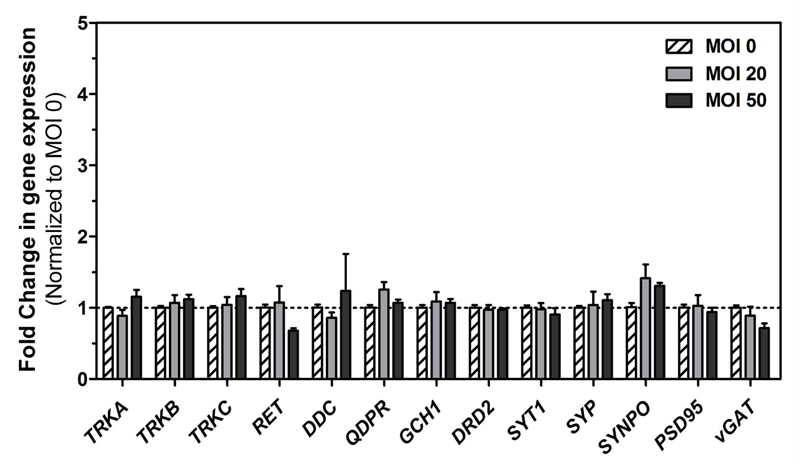
Figure 2.
Gene expression analysis of differentiated neurospheres transduced with hd-CAV-2. Gene expression fold changes (normalized to the MOI 0 control) of neurotrophic receptors (TrkA, TrkB, TrkC and RET), dopamine biosynthesis pathway enzymes (DDC, QDPR, GCH1), dopamine receptor (DRD2), pre-synaptic proteins (SYT1, SYP, SYNPO and vGAT) and post-synaptic protein (PSD95). Each group was performed in triplicates. Data are mean ± s.e.m. of 3 independent experiments.

