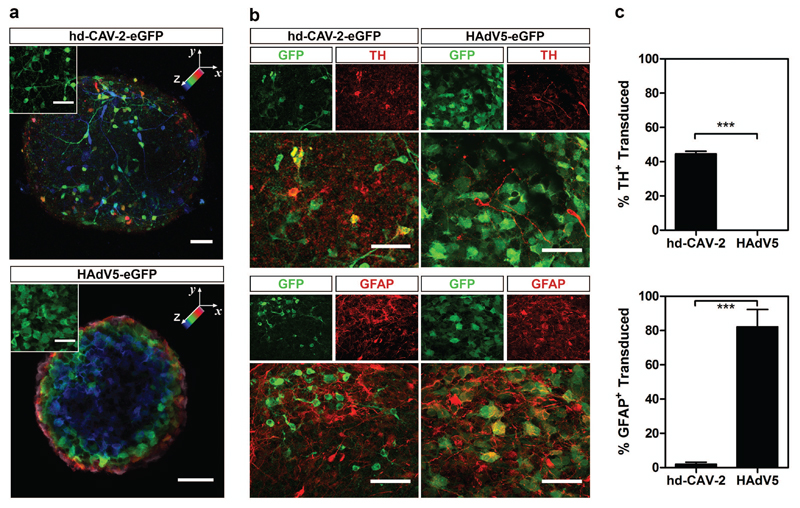
Figure 5.
Characterization of hd-CAV-2 and HAdV5 tropism. (a) Confocal microscopy of hd-CAV-2 and HAdV5 transduced neurospheres. Spatial distribution of transduced cells is highlighted by a depth lookup table. Maximum intensity z-projections of 41 optical sections of 1 μm, where blue indicates 0 μm and pink 41 μm. Inset depicts typical morphology of transduced cells. Scale bars, 50 μm. (b) Immunofluorescence analysis of neurospheres transduced with hd-CAV-2 and HAdV5, stained for TH and GFAP. Maximum intensity z-projections of 55 (TH – hd-CAV-2), 19 (TH – HAdV5), 42 (GFAP – hd-CAV-2) and 23 (GFAP – HAdV5) optical sections of 0.33 μm. Scale bars, 50 μm. (c) Quantification of TH+ and GFAP+ transduced cells for hd-CAV-2 and HAdV5, expressed as percentage of total TH+ or GFAP+ cells. Data are mean ± s.e.m. of 2 independent experiments.

