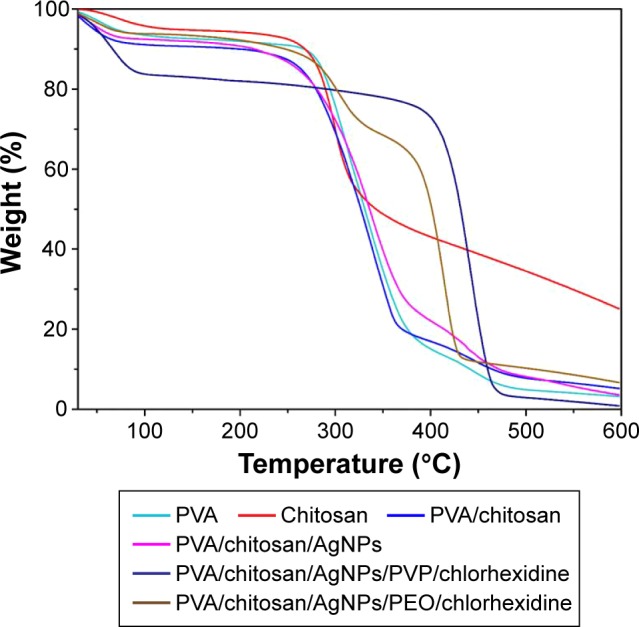
Figure 6.

Comparative result of TGA spectra for all samples.
Notes: TGA shown is for PVA, chitosan, PVA/chitosan, PVA/chitosan/AgNPs, PVA/chitosan/AgNPs/PVP/chlorhexidine, and PVA/chitosan/AgNPs/PEO/chlorhexidine.
Abbreviations: TGA, thermogravimetric analysis; PVA, poly(vinyl alcohol); AgNPs, silver nanoparticles; PVP, polyvinylpyrrolidone; PEO, polyethylene oxide.
