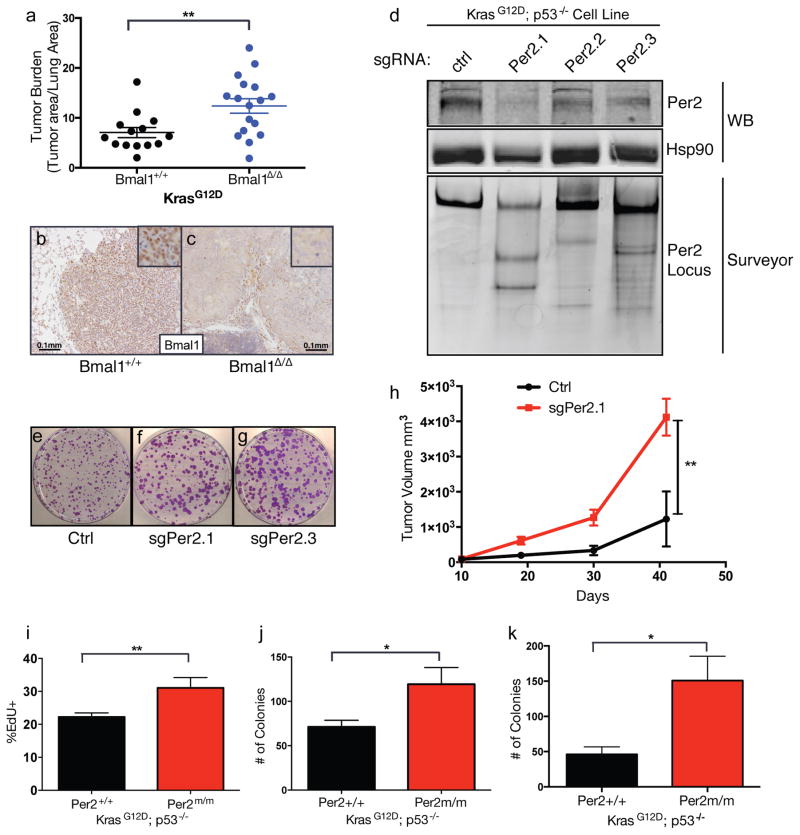
Figure 2. Cell autonomous loss of circadian genes enhances transformation and tumorigenesis.
(A) Graph of histological assessment of lung tumor burden tumor burden in K animals with tumor-specific loss of Bmal1 (Bmal1Δ/Δ) (n=17) compared to WT controls (Bmal1+/+) (n=14). Immunohistochemical staining for Bmal1 in Bmal1+/+ (B) and Bmal1Δ/Δ (C) K tumors, insets represent high magnification images, scale bar=0.1mm. (D) Western blot (WB) and Surveyor analysis of Per2 protein and the Per2 locus, respectively, in KP cell lines where Per2 was target by three different short-guide RNAs (sgRNAs) using the CRISPR/Cas9 system. Representative of three independent replicate low-density clonogenicity assays in Ctrl (E), sgPer2.1 (F) and sgPer2.3 (G) targeted KP cells. (H) Tumor volume measurements of subcutaneous transplanted CRISPR/Cas9-targeted KP murine lung cancer cells. (I) Flow cytometry measurements of EdU incorporation in KP MEFs with WT (+/+) or mutant (Per2m/m) Per2. (J) Colony numbers from low-density clonogenicity assays in WT (+/+) or mutant (Per2m/m) Per2 KP cells. (K) Colony numbers from 3D agar assays of WT (+/+) or mutant (Per2m/m) Per2 KP cells. All experiments in (E–K) represent data from three independent experimental replicates from 3 independent MEF lines. Note: * = p<0.05, ** = p<0.01, obtained from two-sided Student’s t-test. All error bars denote s.e.m.

