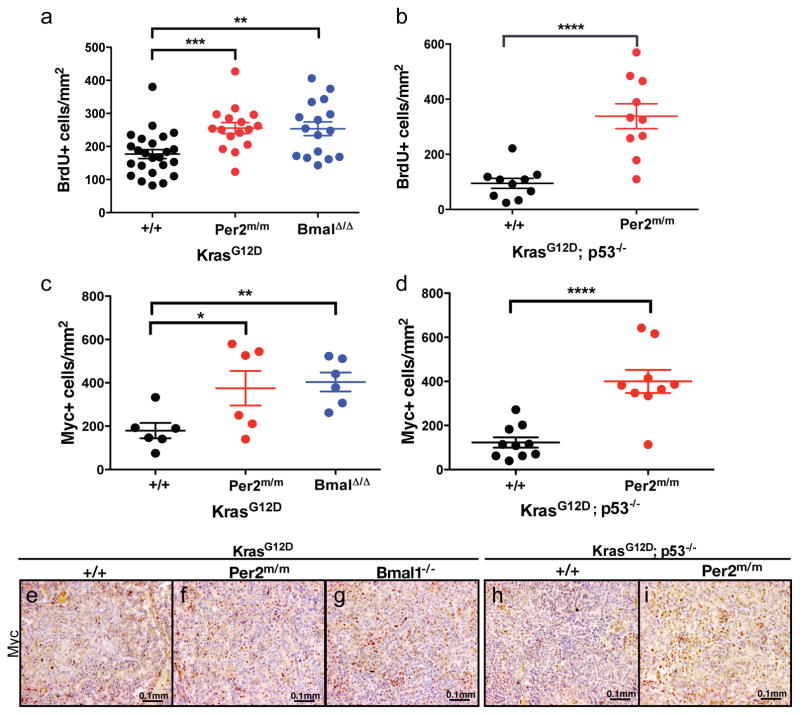
Figure 3. Enhanced proliferation and increased levels of c-Myc in circadian mutant tumors.
Immunohistochemical analysis of BrdU incorporation in tumors from (A) K animals with WT (+/+) (n=24), mutant Per2 (Per2m/m) (n=16) and Bmal1 mutant (Bmal1Δ/Δ) (n=16) tumors; (B) KP animals with WT (+/+) (n=10), mutant Per2 (Per2m/m) (n=10). Immunohistochemical staining of c-Myc (C) K animals with WT (+/+) (n=6), mutant Per2 (Per2m/m) (n=6) and Bmal1 mutant (Bmal1Δ/Δ) (n=6) tumors; (D) KP animals with WT (+/+) (n=10), mutant Per2 (Per2m/m) (n=10). Representative c-Myc immunohistochemical images of: K, (E) WT (+/+), (F) Per2 mutant (Per2m/m), (G) Bmal1 mutant (Bmal1Δ/Δ) and KP (H) WT (+/+), (I) Per2 mutant (Per2m/m). Scale bars 0.1mm. n= individual tumors. Note: * = p<0.05, ** = p<0.01, *** = p<0.001, **** = p<0.0001 obtained from two-sided Student’s t-test. All error bars denote s.e.m.

