FIG. 13.

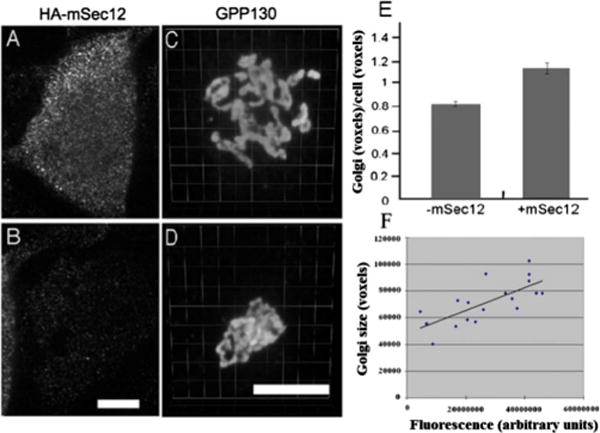
(Color online) Golgi size is increased by expression of the ER-localized GEF. HeLa cells transiently transfected with HA-tagged ER-localized GEF (mSec12) were analyzed to reveal (a) and (b) HA staining as well as (c) and (d) GPP130 shown after 3D rendering. (e) Golgi size normalized to cell volume was quantified in control cells and the cells expressing HA-mSec12. (f) The Golgi size and expression level were also compared on a cell-by-cell basis, with the correlation plot showing a slope of 0.0009. As might be expected, concomitant with the Golgi size increase was an up to 20% decrease in the mean intensity per pixel of GPP130 staining in the defined Golgi region, consistent with dilution of GPP130 in a larger compartment (not shown). Sizes are expressed in voxels, each of which has dimension 0.05×0.05×0.3 μm3. Bar, 10 μm.
