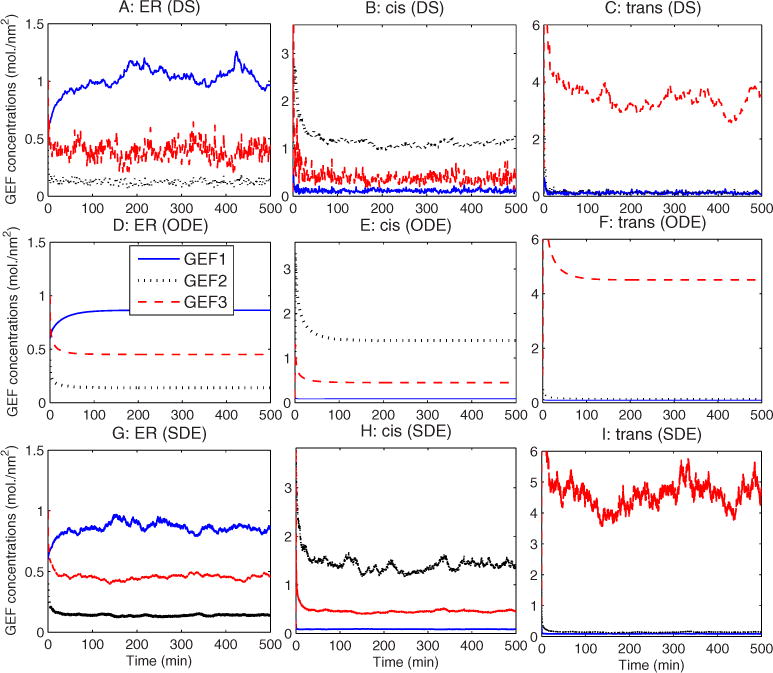
FIG. 4.

(Color online) GEF concentration vs time for the baseline simulation with the (a) – (c) DS simulator, (d) – (f) ODE simulator, and (g) – (i) SDE simulator. The first column (a, d, g) shows concentrations in the ER, the second column (b), (e), and (h) concentrations in the cis Golgi, and the third column (c), (f), and (i) concentrations in the trans Golgi.
