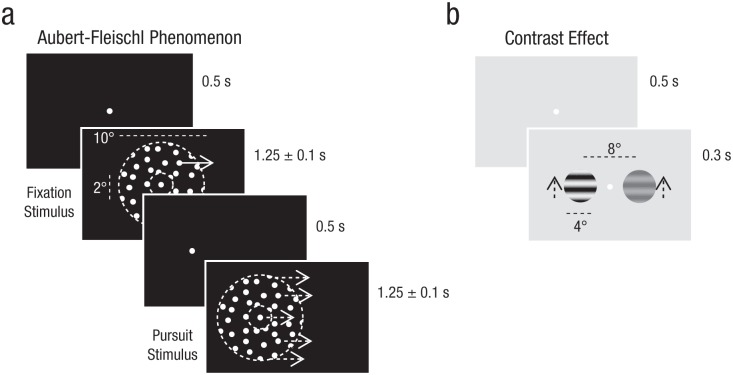
Fig. 2.
Example stimulus sequences used to assess (a) the strength of the Aubert-Fleischl phenomenon (Experiment 1) and (b) the size of the contrast effect (Experiment 2). In each trial of Experiment 1, participants viewed two sequentially presented random dot patterns, each of which moved inside an annulus window (indicated here with dotted lines that did not appear in the actual stimulus display). In fixation displays (in which the fixation point and annulus window were stationary), the dots appeared to move as a rigid sheet within the window, whereas in pursuit displays, the dots, window, and fixation point all moved together horizontally at the same velocity across the screen. The order of stimulus presentation and direction of stimulus movement was randomized across trials. In each trial of Experiment 2, participants viewed two vertically moving gratings presented simultaneously; both gratings were the same except that one was high contrast and one was low contrast. Movement direction (up vs. down) was chosen randomly on each trial. In both experiments, observers had to choose which of the two stimuli appeared to move faster.

