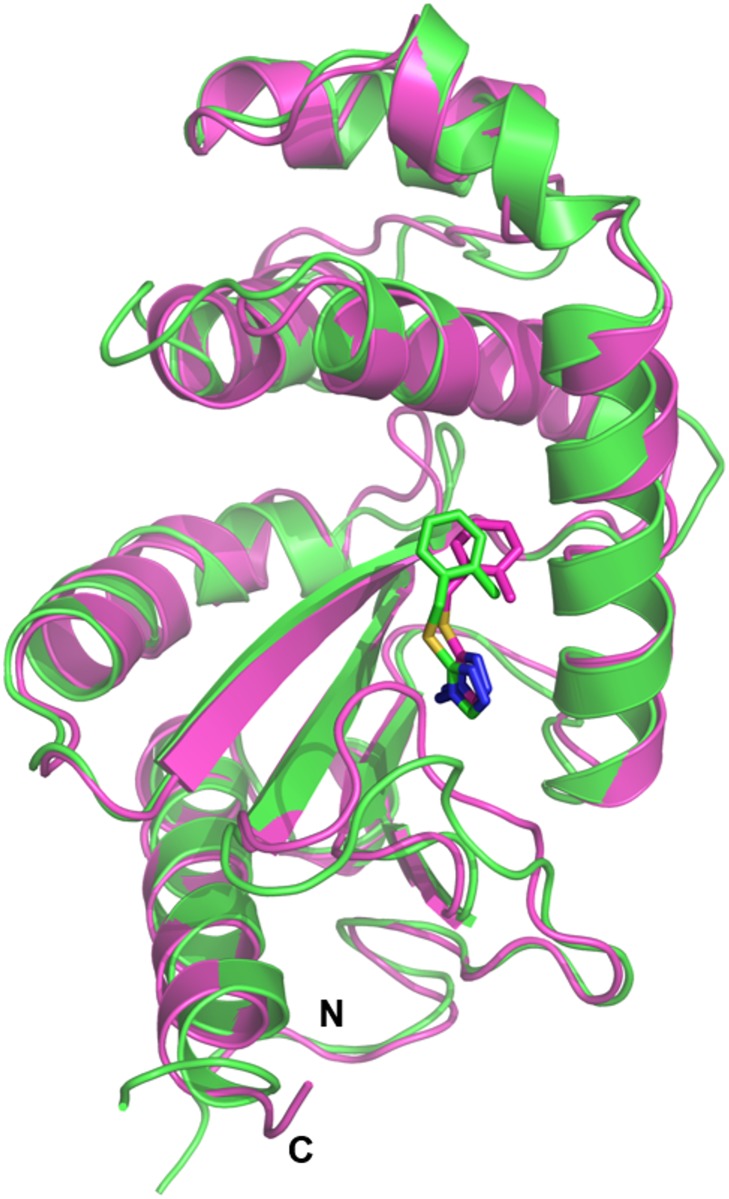
Fig 6. NMR data driven HADDOCK docking model and X-ray crystal structure of PaDsbA1–Fragment 1 complex.
The representative HADDOCK model and the crystal structure are shown in cartoon representation coloured green and magenta, respectively. The binding mode of Fragment 1 (shown as sticks) is similar in both models.

