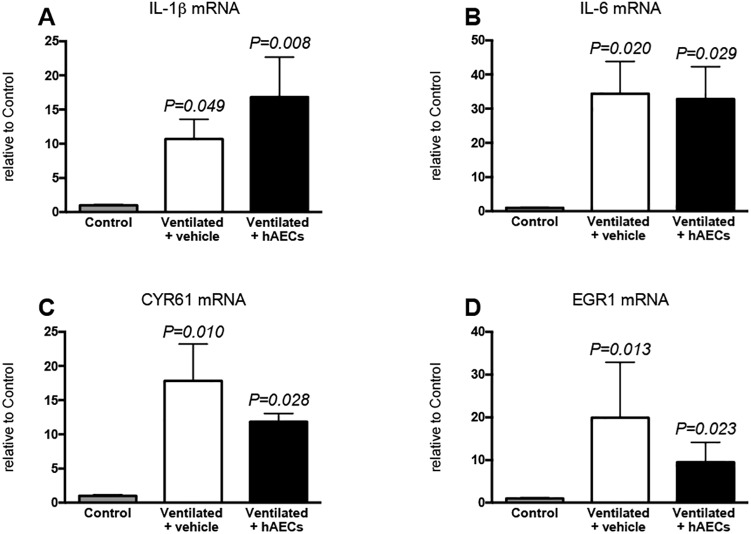
Fig 5.
Lung tissue mRNA levels of IL-1β (A), IL-6 (B), CYR61 (C) and EGR1 (D) in lung tissue from unventilated control lambs (grey bars; n = 5), and vehicle- (white bars; n = 6) and hAEC-treated (black bars; n = 4) lambs. Data were analysed by one-way ANOVA with bonferroni post hoc analysis: P values relate to comparisons with the control group. Data are mean ± SEM.

