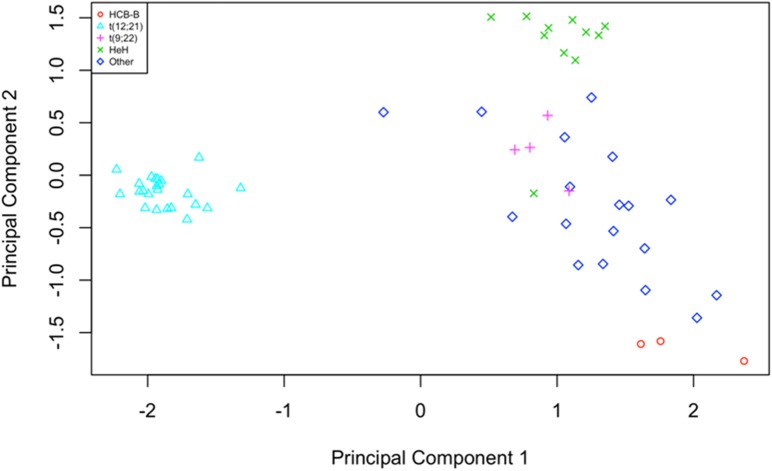
Fig 2. Multidimensional scaling plot of distances between gene expression profiles.
The distance between each pair of samples is the Euclidean distance between expression values (logCPM) of the 500 genes with the most variance across all samples. Samples with an unknown phenotype or belonging to a cALL subtype appearing less than four times in our cohort have been labelled as “Other”.

