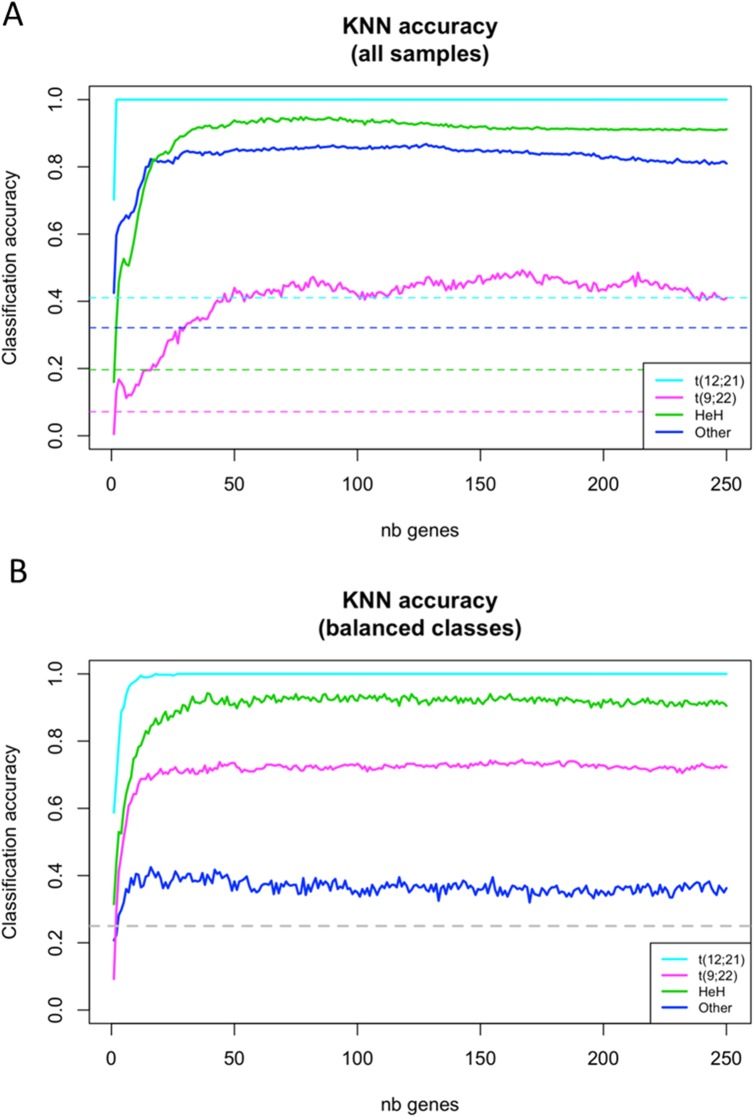
Fig 3. Accuracy of k-nearest neighbors (KNN) classification according to the number of considered top variances genes.
Each continuous line gives the fraction of tumor samples correctly classified by cALL subtype, averaged over 100 replicates. For each replicate, we sampled 50% from all genes and ordered them according to expression (logCPM) variance across samples. KNN (3-nearest neighbors) classification was then performed, considering Euclidean distance between samples based on an incremental number of genes (pseudogenes excluded). (A) Leave-one-out classification was performed using all tumor samples. (B) Under-sampling was performed so that four tumor samples from each subtype were used at each iteration. Dashed lines show the expected accuracies when predictions are made by random assignation of cALL subtype

