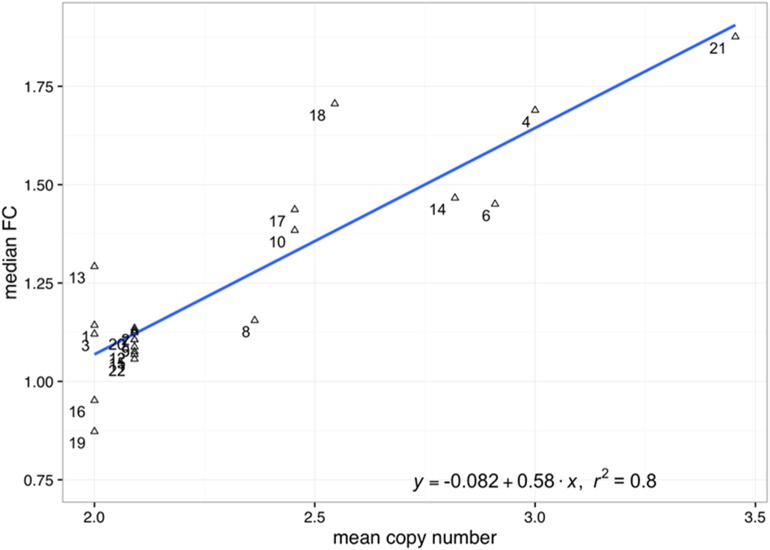
Fig 7. Correlation between median fold change (FC) and average copy number in the HeH group (R2 = 0.8).
The y-axis corresponds to the chromosome median fold-change between the HeH group and HCB controls. The x-axis corresponds to the chromosome mean copy number in the HeH group. To avoid division by very small quantities, we restricted this analysis to genes expressed at >30 counts per million (CPM) in both groups. Only autosomes were included in this analysis.

