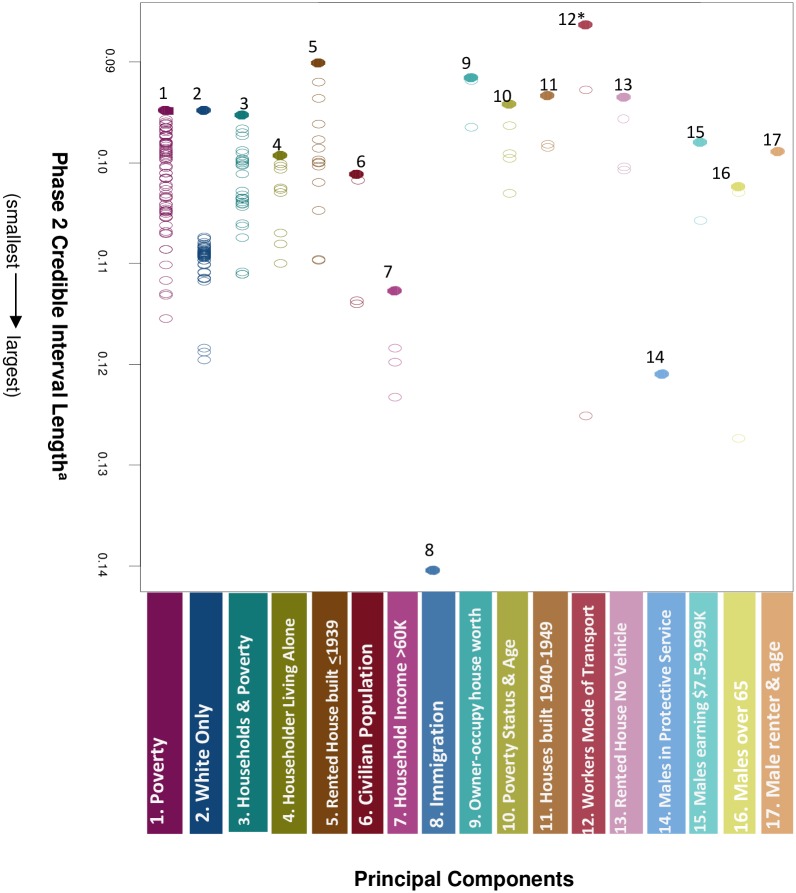
Fig 2. Phase 3-Principal components and fine mapping analysis to identify top hits.
Dots represent single neighborhood variables from Phase 2 (n = 217 total dots). Open dots are color-coded to their respective component (from Phase 3-Principal Components analysis). Closed-colored dots represent the most significant variable within each component (Phase 3-Fine Mapping) and corresponding statistics are provided by component number in Fig 3. *Top hit based on statistical significance from Phase 2 data. a Statistical significance determined by Bonferroni-corrected confidence intervals from the Phase 2 Bayesian model, i.e. smaller credible interval length indicates greater statistical significance.

