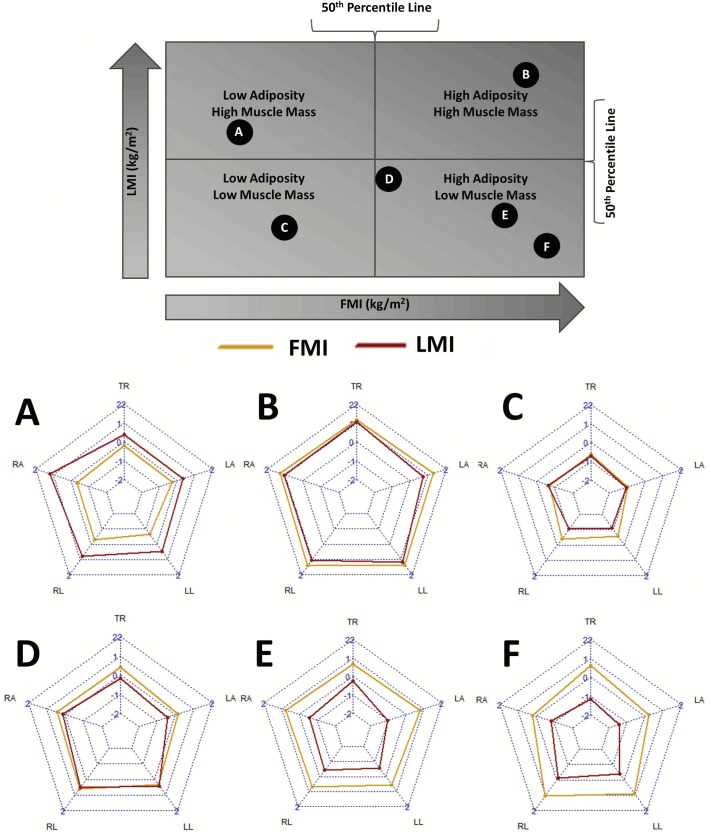
Fig 4. Sample radar charts of individuals in different quartiles of lean and fat mass indices.
Radar charts of individuals as they fit into quadrants of adiposity and muscle mass. Each labeled circle in the above chart corresponds to an individual radar composition chart below. In the radar charts, each spoke represents: TR = Trunk, LA = Left Arm, LL = Left Leg, RL = Right Leg, RA = Right Arm.

