FIGURE 1.

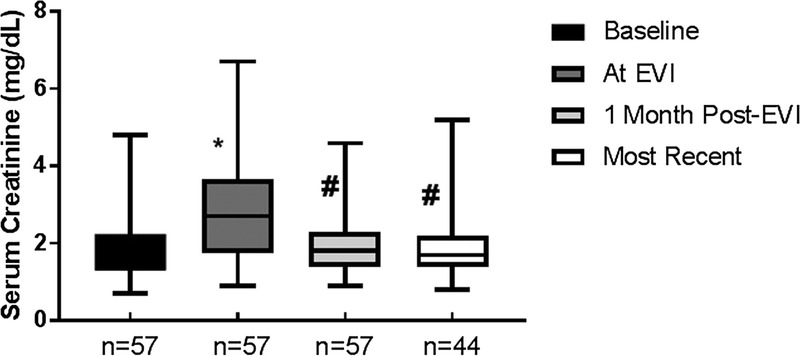
Trends in serum creatinine pre and post-EVI. The mean serum creatinine (Cr) at the indicated time intervals is shown. * Significantly different from baseline (b/l) creatinine. # Significantly different from creatinine at time of EVI.

Trends in serum creatinine pre and post-EVI. The mean serum creatinine (Cr) at the indicated time intervals is shown. * Significantly different from baseline (b/l) creatinine. # Significantly different from creatinine at time of EVI.