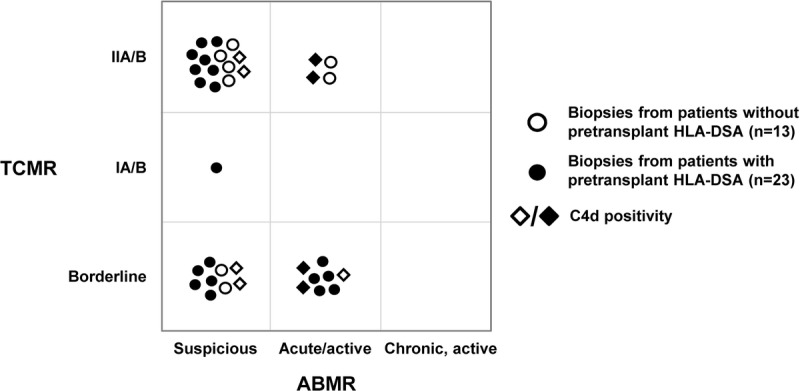
FIGURE 4.

Overview of mixed rejection phenotypes. The composition of mixed rejection phenotypes consisting of the assigned diagnostic categories of both TCMR and ABMR is shown for biopsies from ptDSAneg (loops) and ptDSApos (spots) patients. C4d staining results are incorporated in the shape of the individual data points (◊, C4d positivity).
