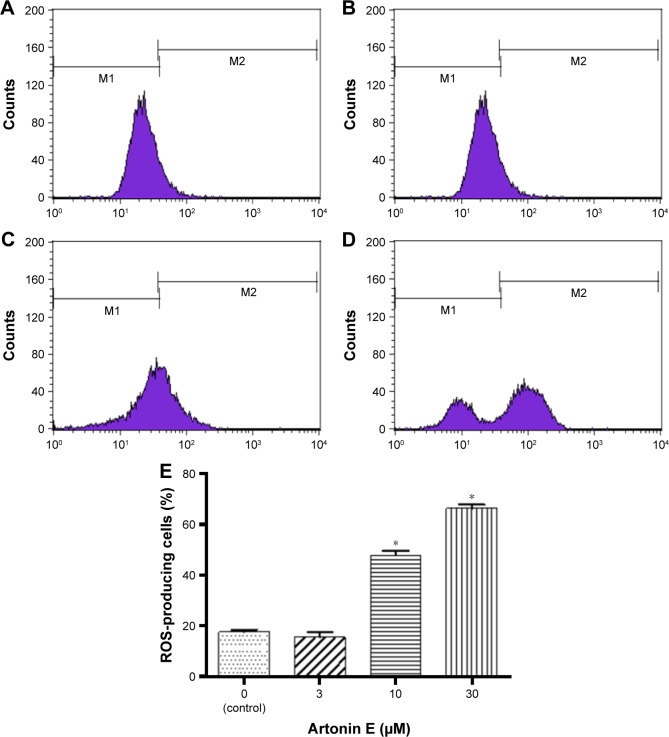
Figure 5.
Total reactive oxygen species (ROS) production by MCF-7 cells after 24-h treatment with Artonin E.
Notes: (A) Untreated control and (B, C), and (D) are treatment with 3, 10, and 30 µM Artonin E, respectively, (E) The analysis of the flow cytometric data. Values are expressed as mean ± standard deviation of three independent experiments. *Means differ significantly (P<0.05) from that of untreated control. M1 = non-ROS, M2 = ROS-producing cell population.

