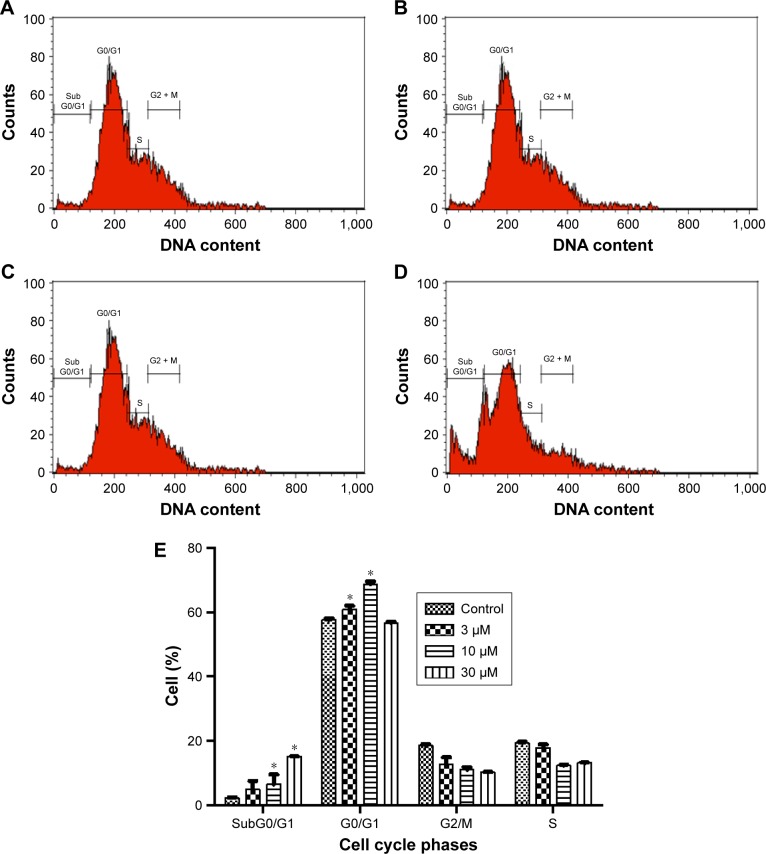
Figure 6.
Artonin E arrests MCF-7 cell cycle after 12-h treatment with (B) 3, (C) 10 µM, and (D) 30 µM Artonin E. (A) Is untreated control. (E) Analysis of cell population in the cycle phases. Values are expressed as mean ± standard deviation.
Note: *Means in each cell cycle phase differ significantly (P<0.05) from that of control.

