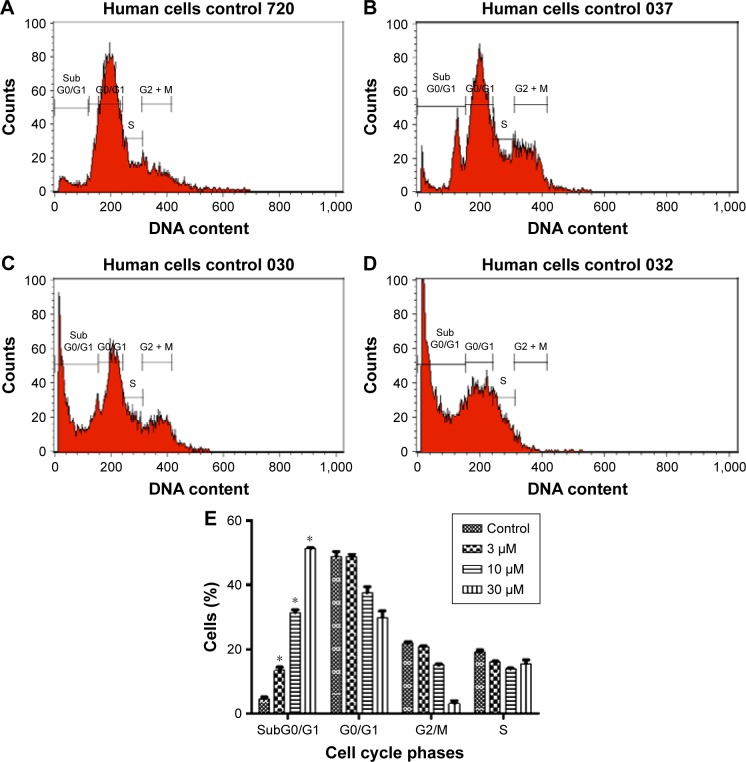
Figure 7.
Artonin E arrest MCF-7 cell cycle after 24-h treatment with (B) 3 µM, (C)10 µM, and (D) 30 µM Artonin E. (A) is untreated control. (E) Analysis of cell population in the cycle phases. Values are mean ± standard deviation.
Note: *Means in each cell cycle phase differ significantly (P<0.05) from that of control.

