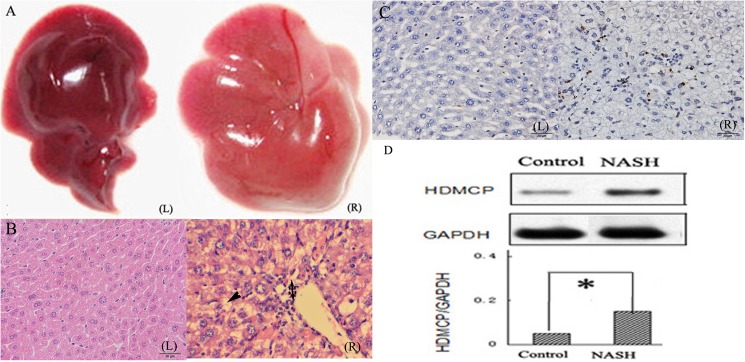
Fig 1. Increased HDMCP expression in NASH mice model.
(A), general image of liver tissue; (B), H-E staining of liver tissue (Single arrow indicates lipid droplet; double arrow indicates inflammatory cell infiltration); (C), apoptosis degree (shown in Table 1) was calculated on the basis of the percentage of apoptotic cell that was shown in brown color, while normal cell was in blue-purple color by Tunel method. (D), relative hepatic HDMCP expression in NASH (n = 8) and control group (n = 8). (L) indicates control group; (R) indicates NASH group; *, p<0.05.

