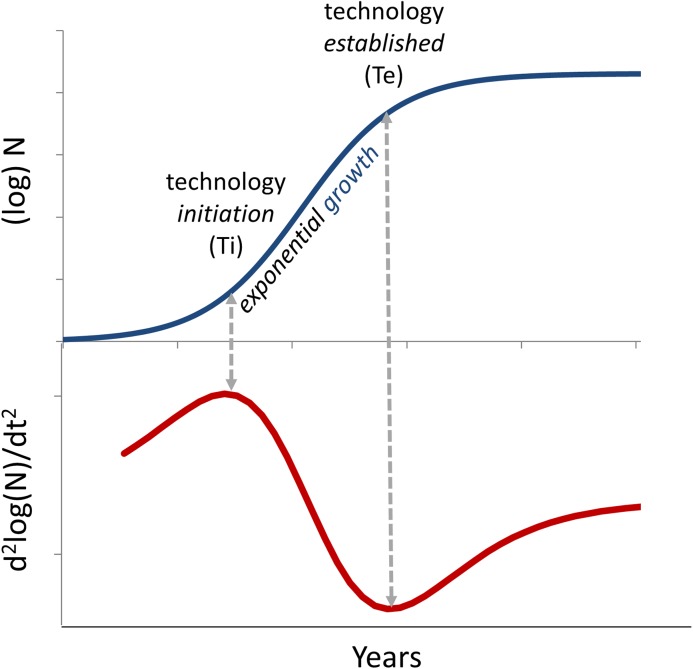
Fig 1. Quantitative model of the technology growth cycle S-curve.
Growth of research in a specific area is modeled by a best-fit logistic equation (black line) fit to the log of the number of publications identified by a PubMed search. New areas of research emerge into a nascent stage and mature through a near-exponential growing stage before becoming established as limits are encountered. The rate of acceleration of the best fit model (red line) (i.e., d2y/dx2) is used to identify the initiation (Ti), representing the point of maximum exponential acceleration, and when the technology is established (Te), representing the point of maximum exponential deceleration of cumulative publications.

