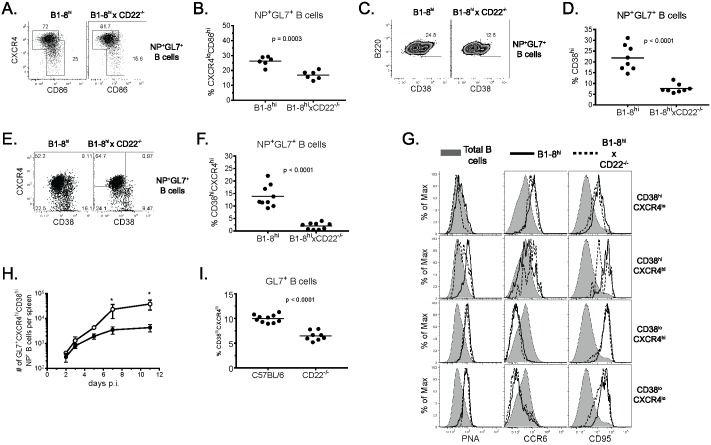
Fig 3. CD22-deficient B cells fail to form CD38hiCXCR4hi GC B cells.
Adoptive transfers and immunizations were performed as in Fig 1. (A) Representative flow cytometric plots show CXCR4 and CD86 expression among NP-specific GL7+ splenic B cells gated as in Fig 2A 7 days p.i. (B) Summary data from 2 independent experiments using 3 mice per group showing the frequency of NP-specific GL7+ LZ (CXCR4loCD86hi) B cells 7 days p.i. Each dot represents an individual animal. (C,E) Representative flow plots show the frequency of cells expressing CD38 (C) or CD38 and CXCR4 (E) among NP-specific GL7+ B cells 7 days p.i. (D,F) Summary data of CD38 (C) or CD38 and CXCR4 expression (E) from 3 independent experiments using 2–3 mice per group. Each dot represents an individual animal. (G) Histograms show PNA, CCR6 or CD95 expression on each population (P1-P4) of NP-specific GL7+ splenic B cells depicted in the diagram at left. Total (shaded), WT (solid line) and CD22-/- (dashed line) B cells are shown. Data are representative of 2 independent experiments using 5–7 mice each. (H) Frequencies of WT (white circles) and CD22-/- (black circles) NP-specific GL7+CD38hiCXCR4hi splenic B cells are plotted over time. Data are from one experiment utilizing 7 mice/group at each time point. (I) Summary data depicting the frequency of CD38hiCXCR4hi GC B cells in WT and CD22-/- mice (E) from 2 independent experiments using 4–6 mice per group. Each dot represents an individual animal.

