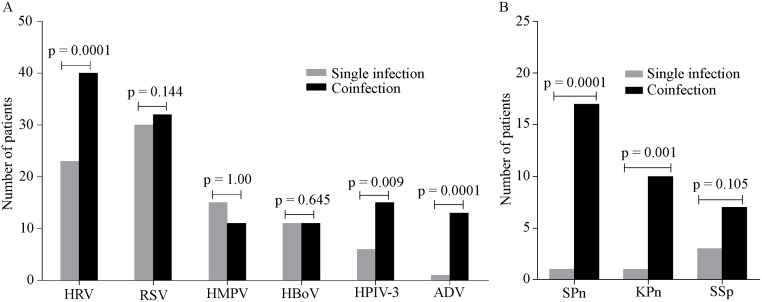
Fig 3. Comparison of frequencies of each pathogen identified in single infections and coinfections.
Fig 3A compares the frequencies of viruses and Fig 3B compares the bacterial pathogen frequencies in single infections and coinfections. Fisher's exact test was performed for each group. P< 0.05 was considered significant. SPn = S. pneumoniae, KPn = K. pneumoniae, SSp = Streptococcus species.

