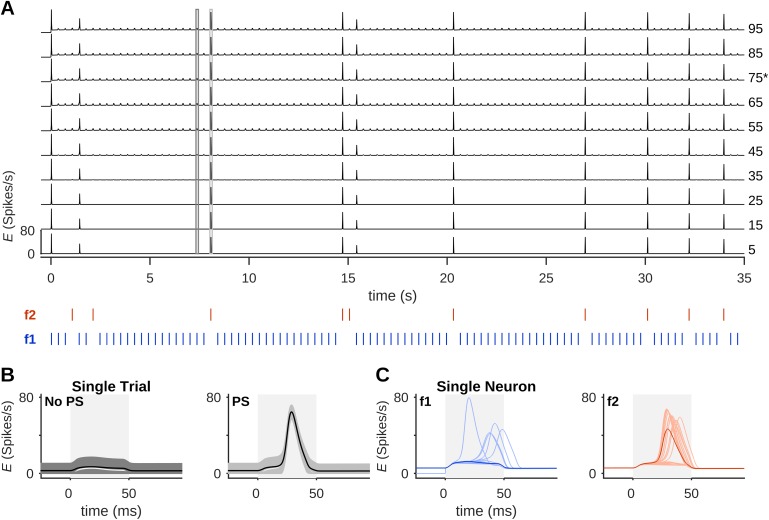
Fig 2. Dynamics of single-neuron and population activity.
(A) The firing-rate, E, of selected neurons in column 11 in response to an oddball protocol (stimuli shown as blue and red bars under the plot). PS responses were usually evoked by deviant stimuli (red) and only rarely by standard stimuli (blue). (B) Single neurons were highly correlated in their single-trial responses, showing either a small transient increase in firing-rate (left) or a sharp concerted increase in firing-rate, which marks a PS (right). (C) All responses of a single neuron (no. 75, marked with an asterisk in (A)) to the standard condition (left, light blue curves) and to the deviant condition (right, light red) during 5 blocks similar to the one shown in (A). Blue and red curves show the average response of this neuron in each condition. In all blocks, input amplitude (A) = 5 spikes/s and inter-stimulus interval (ISI) = 350 ms.

