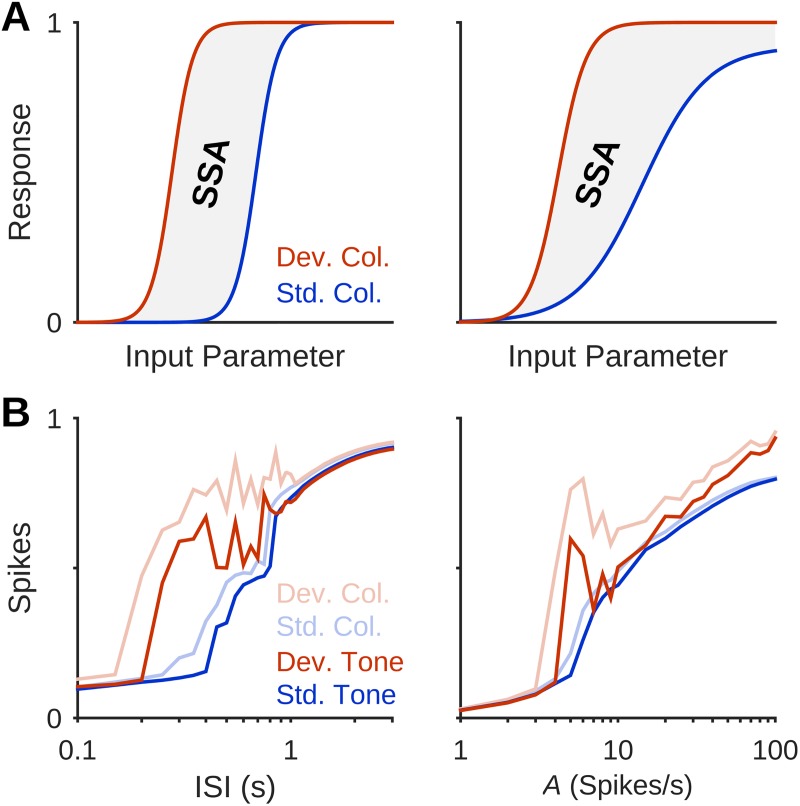
Fig 8. Adaptation shapes the SSA Region by subtractive or divisive operation on the input of column response curves.
(A) Adaptation might affect the response curve of a cortical column in a subtractive (left) or divisive (right) manner. The potential SSA region lies between the response curves of the weakly-adapted deviant column and the strongly-adapted standard column. (B) Response curves of the deviant column and standard column, each to its own best-frequency stimulus (light red and light blue, respectively) for ISI (left) and input amplitude A (right). Red and blue curves show the responses within the middle column to the deviant and standard tones, respectively. Curves demonstrate the effect of adaptation, suggesting a subtractive operation on the logarithmic ISI-scale and divisive operation on the logarithmic A-scale. Responses to the deviant tone were attenuated more strongly in the process of propagating to the middle column compared to standard responses. In all protocols shown here, P = 10%, Δf = 2, U = 0.5, τrec = 800 ms.

