Figure 3.

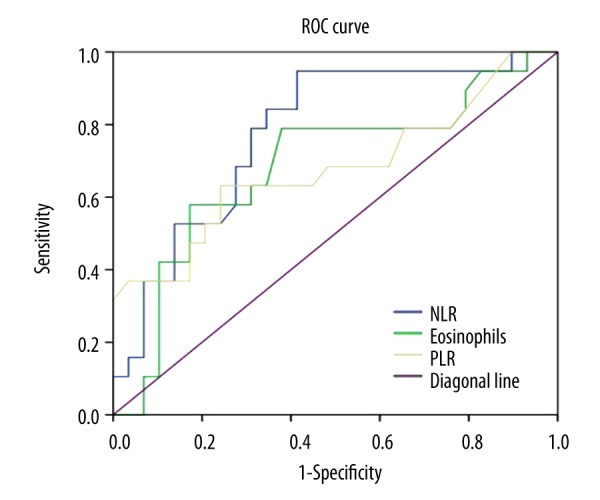
The receiver-operating characteristic curve showing the sensitivity and specificity of NLR, Eosinophils, and PLR with regard to high SCORAD.

The receiver-operating characteristic curve showing the sensitivity and specificity of NLR, Eosinophils, and PLR with regard to high SCORAD.