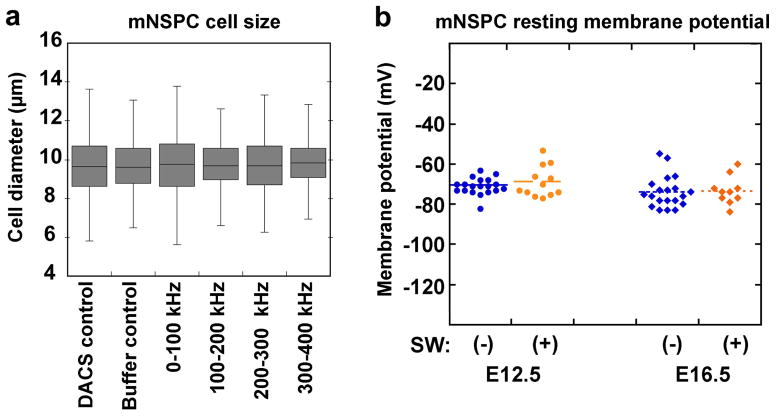
Figure 4. NSPCs isolated into discrete frequency bands do not differ in cell size and resting membrane potential does not differ with mNSPC fate potential or glycosylation state.
a) No difference was observed in the diameters of control cells (unsorted DACS control 0–1000 kHz and DEP buffer control) and cells sorted at distinct frequency bands (0–100 kHz, 100–200 kHz, 200–300 kHz and 300–400 kHz). Error bars show range, lines within box show average. Data were analyzed with Student’s t-test, p>0.05 all comparisons, n=3 independent experiments, n>500 cells per condition.
b) Resting membrane potential was measured using patch-clamp analysis. No significant difference in resting membrane potential was detected between cells isolated at E12.5 (blue circles) or E16.5 (blue diamonds) although these cells differ in fate potential and membrane capacitance (11) (E12.5 (−): −71.0 mV +/− 4.2 s.d., n=19 cells; E16.5 (−): −73.9 mV +/− 7.8 s.d., n=20 cells; p=0.16). Furthermore, treatment of E12.5 (orange circles) or E16.5 (orange diamonds) mNSPCs with the glycosylation inhibitor Swainsonine (+) did not alter their resting membrane potential (E12.5 (+): −68.7 +/− 2.2; n=12 cells, p=0.29 compared to untreated E12.5)(E16.5 (+): −73.3 mV +/− 7.0 s.d.; n=10 cells, p=0.84 compared to untreated E16.5). Each point on the graph represents an individual cell.

