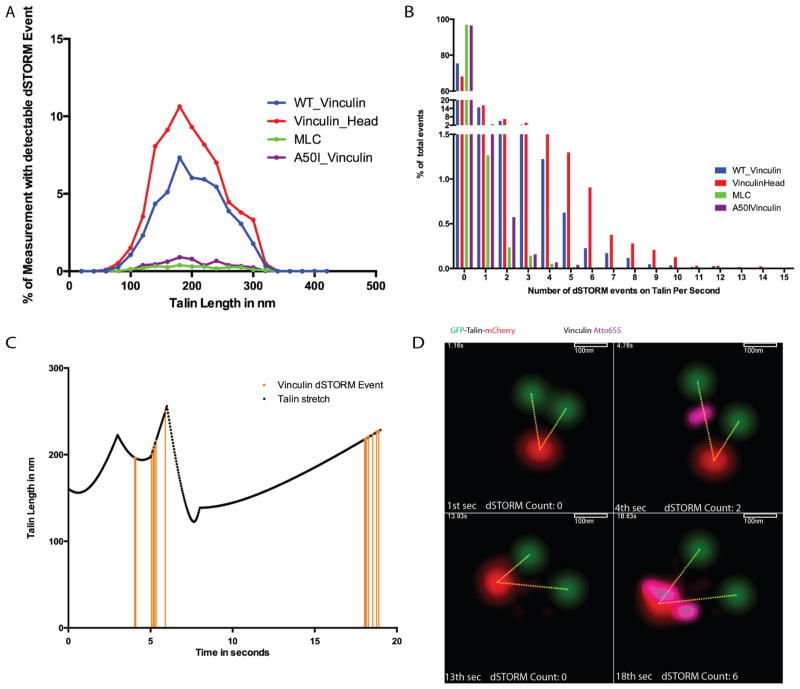
Figure 3.
Vinculin binding events onto talin. (A) Histogram of percentage of one-second intervals that have dSTORM events with respect to the talin stretch length. (B) Percentage of number of dSTORM events within one second over all talin stretch states of all sequences measured. (C) Talin stretch and vinculin dSTORM events of Supplementary Movie 3. Each orange line represents a vinculin dSTORM signal detected on the talin dimer. (D) Localization map of GFP, mCherry (GFP-talin-mCherry), and Atto655 (vinculin-DHFR:L28C, A-TMPAtto655) over four different time points (see Supplementary Movie 3).

