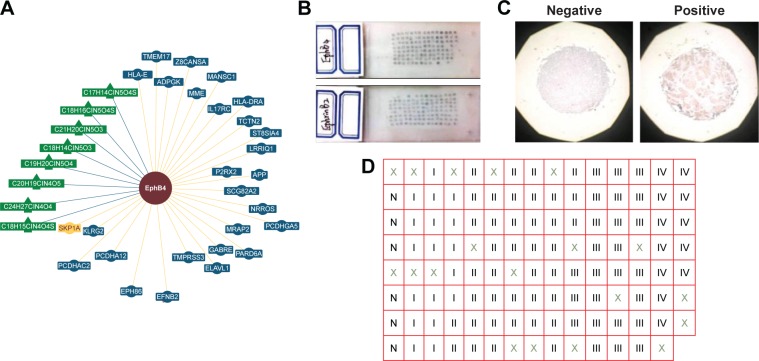
Figure 1.
The interaction between EphB4 and EFNB2 and the distribution of tissue samples.
Notes: (A) There is an interaction between EphB4 and EFNB2 based on genetic interactions in the budding yeast Saccharomyces cerevisiae (reported by BioGRID database). (B and C) The gross photos of tissue microarray and immunohistochemical staining. Scale bars, 400 µm. (D) The tissue samples were arranged as shown in the form N, normal tissue. I, II, III, and IV, pTNM staging; ×, the tissue samples not meeting the inclusion criteria are excluded.
Abbreviation: pTNM, pathological tumor–node–metastasis.

