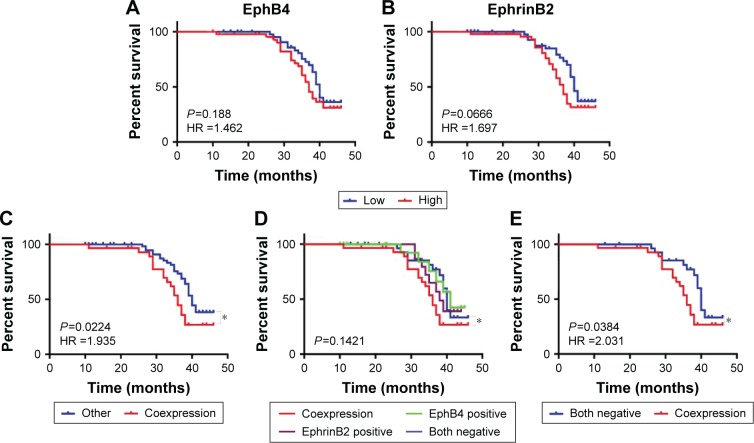
Figure 4.
Kaplan–Meier analysis of overall survival in HER2-positive breast cancer
Notes: (A, B) Kaplan–Meier analysis of overall survival of HER2-positive breast cancer patients. Samples were divided into two groups with high and low expression levels of EphB4 and EphrinB2. (C, D) Kaplan–Meier analysis of overall survival through different subgroups. (E) Patients were divided as in (D). P-values are obtained from the log-rank test. Hazard ratio (HR) is calculated using GraphPad Prism. *P<0.05 (Student’s t-test).
Abbreviation: HR, hazard ratio.

